Visualize
Progress checklist
Overview
Section titled “Overview”Lab completion is objects verified in S3. Visualization is optional.
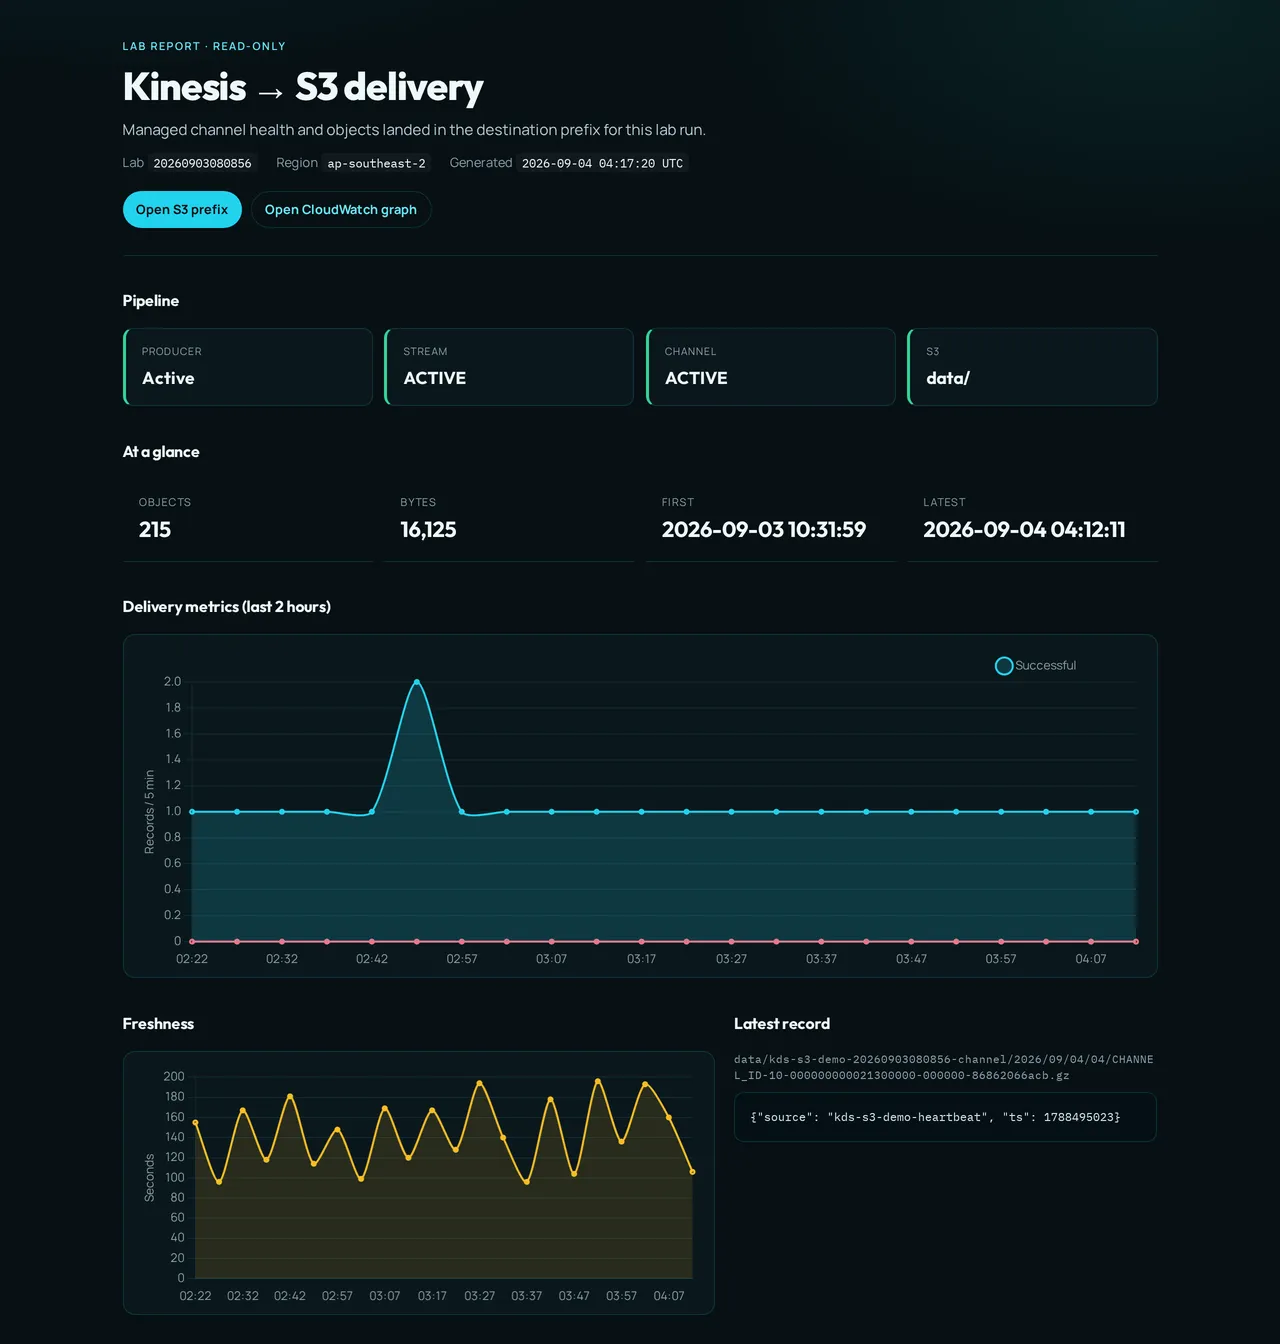
demo.sh viz builds a self-contained HTML report (.lab/viz/report.html) using the same
site fonts and palette as this walkthrough:
- Pipeline status — producer → stream → channel → S3
- DeliveryToS3 Successful / Failed / Freshness charts (last 2 hours)
- Latest decompressed record and recent object table
- Buttons into the S3 prefix and CloudWatch graph
Read-only AWS CLI calls only (needs python3 on PATH). Re-run viz to refresh.
-
Build and open the report:
Terminal window export AWS_PROFILE=sandboxexport AWS_REGION=ap-southeast-2./scripts/demo.sh vizLooks like:
Building delivery report…Report …/.lab/viz/report.htmlLab LAB_SUFFIXBucket s3://kds-s3-demo-LAB_SUFFIX-ACCOUNT_IDChannel kds-s3-demo-LAB_SUFFIX-channel (CHANNEL_ID)Opened in the default browser.The report opens in the browser (pipeline, DeliveryToS3 charts, latest record):
-
Use Open CloudWatch graph in the report for the interactive console view (same three dimensions as Verify in S3). With the heartbeat producer you typically see a steady
SuccessfulRecordCountnear one per interval andFailedRecordCountat zero: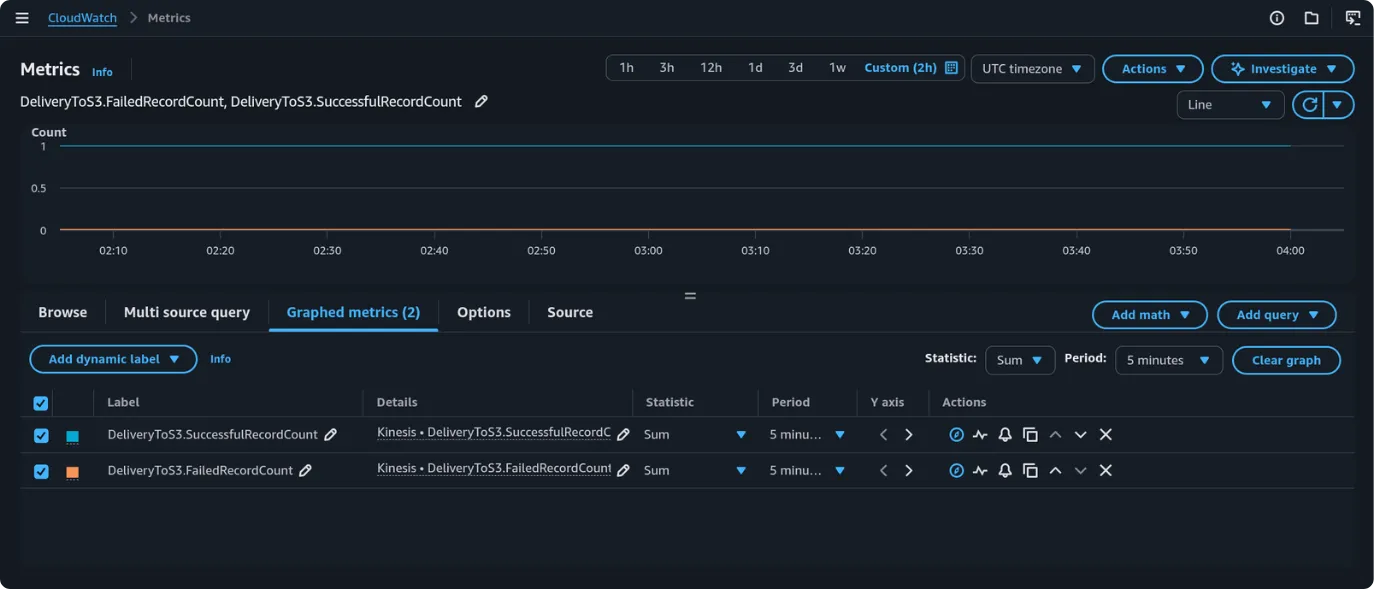
Re-run
vizafter another freshness window to refresh the local HTML charts.